
Allison Werner January 15, 2024
Neutral market, here we come! We love reviewing the statistics and helping you make sense of what is happening in the real estate market locally. We are happy to see an exit of the rollercoaster riding, post-pandemic craziness, inflated ups and downs of the last 2-3 years. When we zoom out and look at Q4 2023 compared to last year and the same quarter 5 years ago, we are starting to see a leveling out of the craziness, a smoothing of the peaks and valleys, and a more peaceful neutral market on the horizon. It is true that Sarasota's price-scape may have simply altered forever, but the run-on-the-bank demand and subsequent rebound of inventory seems to be chilling out. The lap belts have released and we are all being escorted off the roller coaster.
We have spent the better part of the last year helping everyone get some perspective on the current marketing conditions, namely that the pandemic created a market microcosm that acted different from our regular market. Looking at recent data in a time-limited, short-term bubble does us no favors and gives us some seriously off false stories about what is really happening in our market. So let's zoom out in order to get the true lay of the land.
Frankly, we have seen sales prices all over the place over the past year. Recently, we've seen gorgeous places have had to reduce their prices for the first time in ages, and yet some areas are still selling well above historical averages. Prices have changed irrevocably, and we are seeing asking prices in Sarasota now that we have never, ever seen before (tens of millions). With the overall uptick in the pricing structure of our market, volatility like mortgage rates may make less of a difference than it used to, as our market gets flooded with more cash buyers than previously. This can stabilize many other market conditions, even as the price climbs to new heights.
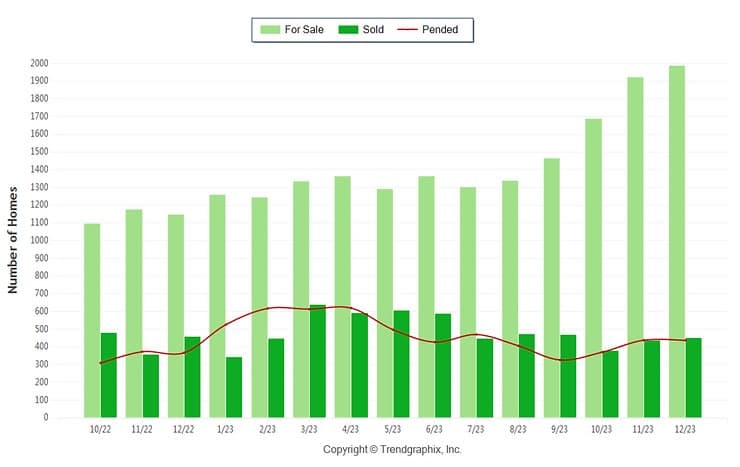
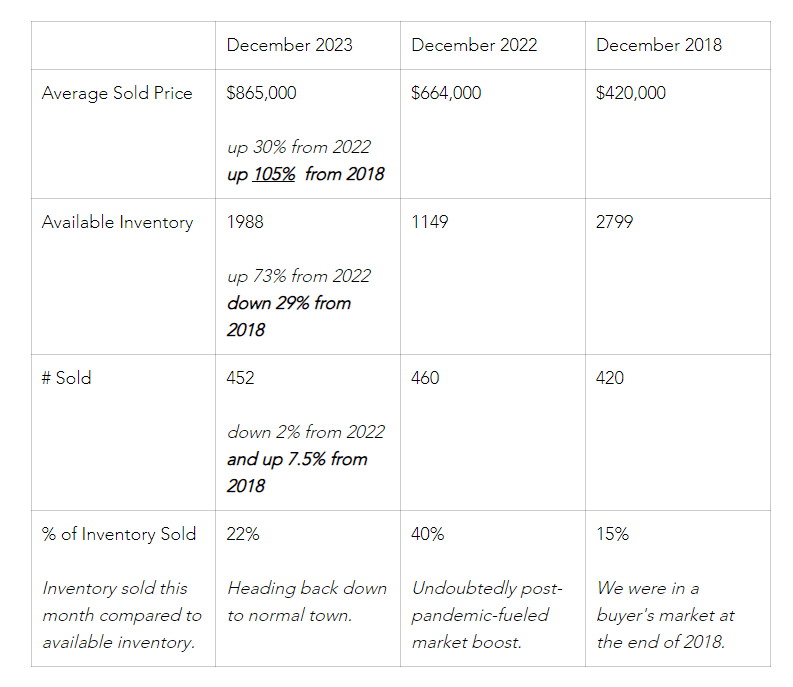
Here's what the stats say:
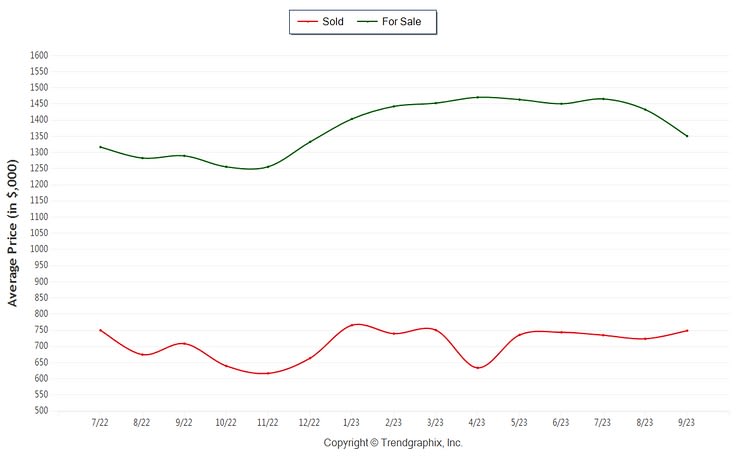
The quick reactions to this chart tell a completely different story than our paragraph just above the chart, and this is why you cannot trust the short-term data alone. Everything here looks pretty stable. Prices are stable. Asking prices are pretty stable. If you're asking yourself, "Why is this blog saying that prices are higher than ever?" read on.
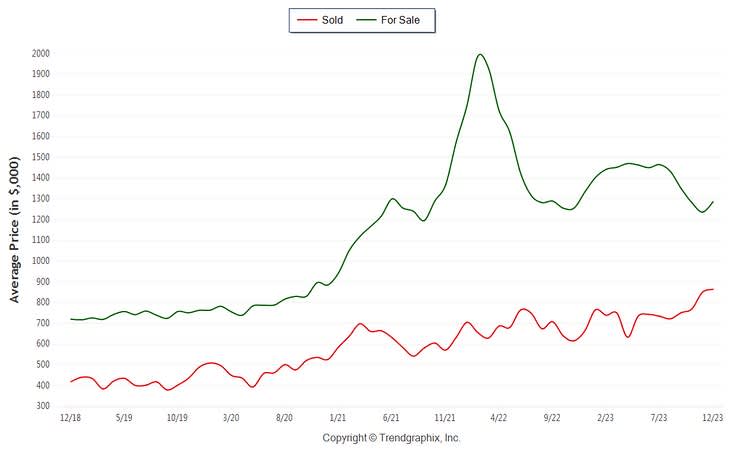
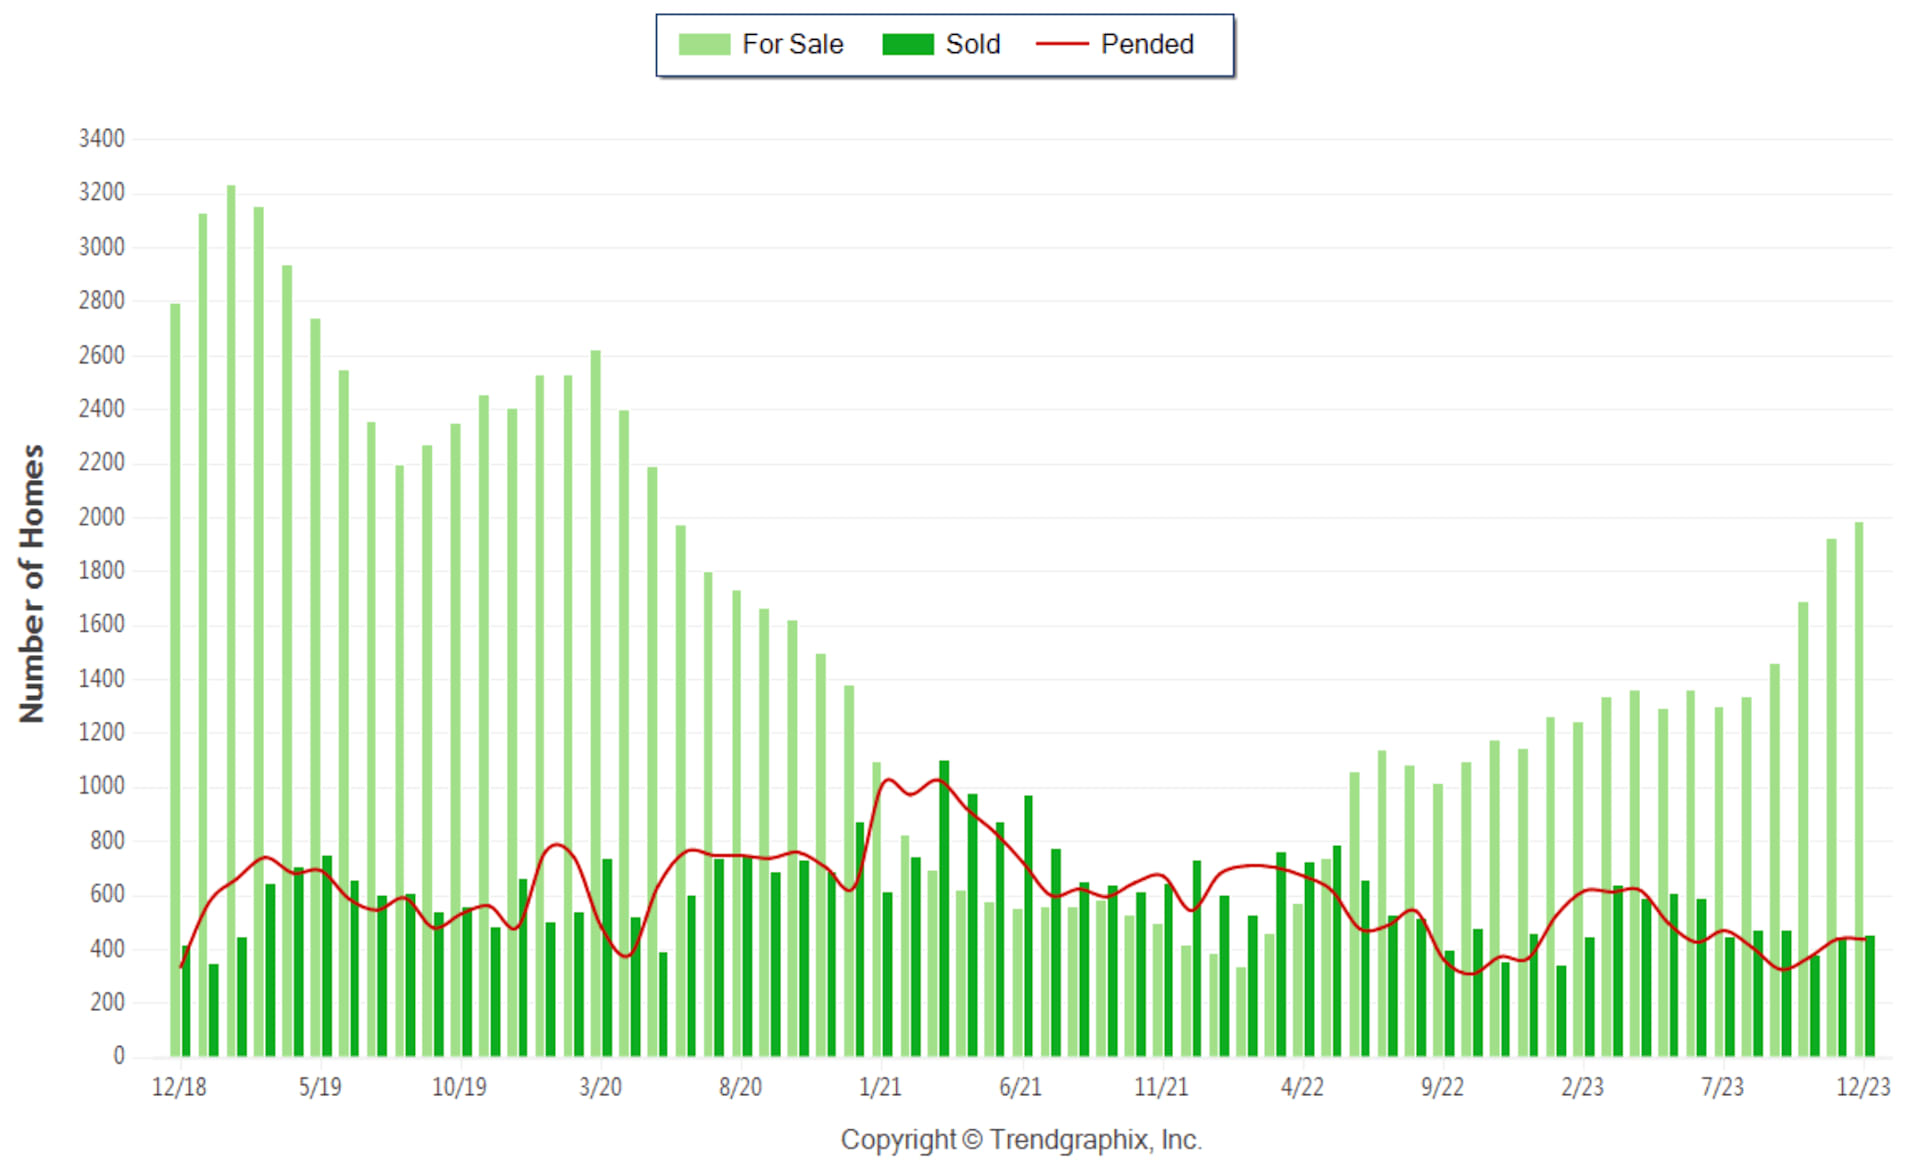
Rational reactions when we see the full story:

Someone without years of experience will be operating from a different frame of mind, viewing recent market activity as a slowdown, or even an alarming decline, compared to recent history. Those of us who have been around the market for longer realize that we are still in a very healthy place, as well as have the experience to know how to operate in a more balanced market. We've lived through the recession, recovery, pandemic, boom, and now back to this neutral state. No panic here! Different markets require Real Estate Agents to adjust themselves just like it requires buyers and sellers to adjust their expectations. A balanced market should not scare you and it definitely does not scare us!
Stay Up to Date on the Latest Real Estate Trends
Sarasota Real Estate
Allison Werner | April 12, 2024
Allison's Sales in Q1 Span The Keys & Beloved Sarasota Neighborhoods

Sarasota Lifestyle
Allison Werner | April 11, 2024

Real Estate
Allison Werner | March 19, 2024
A Douglas Elliman Exclusive

Downtown Sarasota
Allison Werner | March 12, 2024
Downtown Sarasota's Toastique is a fun place to grab a quick bite.

Downtown Condos
Allison Werner | March 4, 2024
7 Years Later...VUE is still dazzling on Sarasota's coast
Allison Werner | February 27, 2024

Sarasota Real Estate
Allison Werner | February 21, 2024
Allison's recent sales in Sarasota

Allison Werner | February 3, 2024
Having someone else in the middle of these discussions would have smoothed a lot of ruffled feathers in our situation.
Allison Werner | February 2, 2024
But Sarasotans are no stranger to famous folks living here! Here are some of our famous neighbors.
Allison brings an unparalleled attention to detail to every transaction, a wealth of knowledge on home staging, deep experience with the Sarasota market, and the tenacity to find what’s fabulous about a home and make others see it too.